
THE BLOG
AI and Office Space Demand

How much space will you need in 3, 5, 10 years?
A new genre of research is emerging. Call it AI-impact modelling.
The approach goes something like this. Take every occupation in the economy. Decompose each into its constituent tasks - data entry, document drafting, scheduling, analysis, negotiation, physical labour. Score each task for AI susceptibility on a scale of 0 to 1. Weight the scores by how much time each occupation spends on each task. Apply an adoption discount to reflect real-world barriers. Out comes a number: the “practical AI impact” for every job in the economy.
The methodology traces back to Eloundou et al.’s influential 2023/24 paper “GPTs are GPTs,” which assessed GPT-4’s capability against occupational tasks. Since then, the ILO, the OECD, Felten et al., and most recently the UCL/Cardiff GAISI study have all built on or extended the framework. It has become the default approach for estimating AI’s labour market impact.
And the numbers are eye-catching. Depending on whose model you look at, somewhere between 25% and 45% of the average knowledge worker’s tasks are susceptible to AI automation. Apply discount factors for adoption barriers, layer on displacement assumptions and timeline projections, and you get headline figures about millions of FTE capacity freed, hundreds of thousands of office jobs at risk, and tens of millions of square feet of space demand evaporating.
These models are proliferating because there’s a commercial appetite for them. Occupiers want to know how much space they’ll need. Investors want to know whether their assets are exposed. Consultants want to sell certainty into an uncertain market. And a multi-hundred-occupation spreadsheet with scenario matrices and regional breakdowns certainly looks like certainty.
It isn’t.
WHAT THE EVIDENCE ACTUALLY SHOWS
Before I explain why the models don’t work, let me acknowledge that something real is happening. The GAISI study (UCL, Cardiff, Oxford, Surrey - August 2025) found that job postings in AI-exposed occupations were 5.5% lower in Q2 2025 than pre-ChatGPT trends would predict - roughly 84,000 fewer postings per month. The pay premium for AI-exposed tasks fell ~12% between 2017 and 2024. Displacement effects appear, at present, to outweigh productivity-driven gains in labour demand.
But notice what this actually measures: hiring decisions. Firms choosing not to fill roles, restructuring teams, rethinking workflows. The real signal is in the aggregate behaviour of employers, not in theoretical task scores.
WHY TASK BASED MODELS DON’T WORK
Here’s the fundamental problem.
The capability scores are already stale. Every major task-exposure framework was built to assess capabilities circa 2023 - primarily GPT-4. Even GAISI, published in 2025, used GPT-4o and Gemini 2.5 Pro for its task ratings. GPT-4o was not a reasoning model, and while Gemini 2.5 Pro is more capable, both have already been superseded. Current frontier systems are qualitatively different, and in 18 months they’ll be different again. Using a 2023 capability snapshot to project 2031 or 2036 labour markets is like using a 2015 smartphone to predict what your phone would do today.
The adoption discount is a guess wearing a lab coat. These models typically apply a uniform discount - say 0.6 - to all occupations, reflecting the gap between what AI cando and what organisations will deploy. But adoption varies enormously. A fintech processing team will hit 85% AI integration years before an NHS trust reaches 30%. A flat discount applied uniformly creates false precision while masking the variation that actually matters.
The precision is theatrical. When a model tells you that a particular occupation faces a practical impact of 34.332% and will have 12.70284 hours freed per week - that level of specificity implies extraordinary confidence. The real uncertainty band is ±15 percentage points at best. Six decimal places on a qualitative assumption is not data science. It is aesthetics.
And jobs don’t work like this. This is the deepest problem. The entire framework treats occupations as fixed containers with automatable components. You take today’s task mix, score each piece, and calculate what percentage gets “freed up.” But that’s not how AI changes work. What happens in practice is that roles get redesigned, merged, split, and reinvented. A financial analyst who used to spend 40% of their time gathering data doesn’t just get that 40% back as spare capacity. The role transforms. Expectations rise. New responsibilities appear that didn’t previously exist.
The model is treating the subject as a photograph when it is actually a video.
Changing all the time.
In practice, you might as well just guess. You’d get a different number, but it wouldn’t be meaningfully less accurate. And the spreadsheet version is arguably worse than an honest guess - because the aesthetic of precision triggers all manner of anchoring biases in anyone not deeply sophisticated in their data analysis. Hand a board a number with six decimal places and they’ll treat it as a fact. That’s not a useful tool. It’s a crutch that could lead to a string of bad decisions.
THE QUESTION THESE MODELS GET WRONG
But there’s a deeper problem than imprecision, and it comes from recent work by MIT’s David Autor and Neil Thompson.
Their June 2025 paper “Expertise” argues that the standard task-based approach asks the wrong question entirely. It’s not how much of a job AI can automate that matters. It’s which parts.
The insight is this: when automation removes the low-expertise tasks from a job - the routine data gathering, the basic processing, the scheduling - the remaining work concentrates around higher-expertise activities. The job becomes harder, more specialised, and better paid. But fewer people can do it, so employment in that role falls.
When automation removes the high-expertise tasks - the complex analysis, the specialist judgement - the job gets easier. More people can do it. Employment expands, but wages drop.
Autor and Thompson document this empirically across 300+ US occupations over four decades. Their accounting clerk example is instructive: computers eliminated much of routine bookkeeping between 1980 and 2018, yet while employment fell by a third, real wages rose by nearly 40%. The remaining work - reconciliations, exception handling, judgement calls - was harder and more valuable.
Inventory clerks went the other way. Automation removed their most skilled work - technical analysis, compliance checks - leaving basic counting and stocking. The job became easier, wages fell, and employment expanded as more people could now do it.
As Neil Thompson put it: taxi drivers once relied on deep knowledge of local streets as a real differentiator. GPS automated that expertise. The result was a more commoditised service - lower wages, many more drivers.
The same task. The same “automation exposure.” Completely opposite outcomes - for wages, employment, and the kind of space those workers need.
This matters enormously for office space demand, because the task-based models produce a single number per occupation and treat it as if it tells you something about future space requirements. It doesn’t. You need to know the direction of the expertise shift.
If AI removes the grunt work from professional roles - the research, the routine drafting, the data processing - the remaining workforce is smaller, more expert, more senior, better paid, and likely needs better space. Less total square footage, but higher quality. More collaborative, more client-facing, more premium.
If AI removes the high-expertise components and commoditises the role, you get more people doing simpler work for lower pay. The space requirement shifts toward cheaper, more generic, possibly non-office settings. Same occupation. Same AI exposure score on the spreadsheet. Completely different implications for your portfolio.
WE NEED A BIGGER PIE
There’s another variable that every task-based model ignores: growth.
The bottom line is an absolute certainty: AI means we will need fewer people to achieve our current level of output.
The question is whether the pie stays the same size. If an economy grows - new products, new services, expanded demand - then productivity gains get absorbed into expansion rather than headcount reduction. Jevons paradox: when something becomes cheaper and more efficient, demand for it can increase.
But growth doesn’t always bring jobs. Bloomberg recently highlighted an unprecedented “jobless boom” in the US - GDP growing while non-farm payroll growth flatlines. The divergence has never been this persistent this far into an expansion. If AI reinforces that pattern, even economic growth won’t necessarily translate into office demand.
For a low-growth economy like the UK, the arithmetic is harder still. Productivity gains without matching demand growth translate directly into headcount reduction. This macroeconomic context is absent from every task-based model I’ve seen, and it’s arguably the most consequential variable in the system.
HOW TO ACTUALLY THINK ABOUT THIS
So if spreadsheet determinism doesn’t work, what does?
The answer is to stop pretending we can model 10 years of AI-driven change with decimal places and instead be honest about what’s knowable at different time horizons.
Three years out is an engineering problem.
Most relevant variables are already observable. Lease structures are signed. Supply is largely consented. Hybrid patterns have stabilised. AI adoption is still early for most firms.
Three-year demand is a function of things you can measure today: lease expiry profiles, observed attendance rates, sector-level employment trends, and the hiring slowdowns GAISI is already documenting. The methodology should be empirical, not modelled.
Five years is where it gets genuinely hard - but not impossible.
AI capabilities in 2031 will be radically different from today, but organisational adaptation will still be incomplete. Too far for extrapolation, too near for speculation.
The right framework here is not task decomposition. It’s two variables: productivityand growth. How much more productive will AI make your people - actually, not theoretically? And is demand for your output expanding or flat?
These interact. And they produce radically different space outcomes.
Take a company with 500 people currently occupying 60,000 sq ft. Run it through four scenarios over a five-year horizon:
Scenario 1: Low growth, high AI productivity gain Output +10%. Productivity +40%.The toughest scenario for space. Headcount drops to ~390, space requirement to ~47,000 sq ft - a 22% reduction. And per Autor/Thompson, AI has stripped out the routine work, leaving a smaller, more senior team. They don’t just need less space. They need different space - more collaborative, more client-facing. This firm is handing back a floor and upgrading what remains.
Scenario 2: Low growth, low AI productivity gain Output +10%. Productivity +15%.Nothing dramatic. Headcount drifts to ~480, space to ~57,500 sq ft - barely a 4% reduction. The firm absorbs AI gradually, trims a few roles through attrition, renews at roughly the same size. Most organisations today are probably closer to this than they’d like to admit.
Scenario 3: High growth, high AI productivity gain Output doubles (a fast-growing tech or professional services firm, say). Productivity +40%. Jevons paradox in action. Growth absorbs the productivity gain and then some. Headcount rises to ~715, space to ~86,000 sq ft - a 43% expansion. But the type of space changes dramatically: fewer individual desks, more project space, more client-facing environments.
Scenario 4: High growth, low AI productivity gain Output doubles. Productivity +15%.Growth without much AI transformation. Headcount expands to ~870, space surges past 104,000 sq ft. Scaling the old way - more people, more desks. But this may be the least likely scenario over five years, because firms growing this fast tend to invest most aggressively in AI.
The point is not that these numbers are precise - they’re napkin maths. The productivity ranges (15-40%) reflect early-adopter evidence: coding teams reporting 30-50% gains, legal and customer service operations seeing 2-3x throughput. Many firms will be lower, particularly over five years. Over ten - which is more typical of CRE investment horizons - these ranges become conservative. But they show what task-based models fundamentally miss: the same AI productivity gain can mean 22% less space or 43% more space, depending on whether a firm is growing. No occupation-level task score tells you which one you’re in. Only your own strategic context does.
These scenarios assume constant density at 120 sq ft per person. In practice, collaborative space runs larger per head than desk-based processing space - which narrows the reduction in Scenario 1 but reinforces the point about character over quantity.
And the Autor/Thompson expertise lens adds a third variable: what kind of space? In three of four scenarios, routine processing work diminishes and expert, collaborative work grows. The square footage number alone misses this. You might need less space in total but higher specification - or more space of a fundamentally different kind.
NOTE: There are other variables these scenarios don’t capture - attendance patterns, peak-load coordination, the logic of signing a five-day lease for three-day usage, whether co-location becomes more or less important as teams shift to creating and curating AI agents. These are real and consequential. But they are also deeply specific to each organisation’s culture, stage, and ways of working - and largely unknowable over a 5-10 year horizon. They reinforce the point: the answers live inside each company’s particular circumstances, not in a macro model.
Ten years is scenario territory.
Anyone offering a 10-year office demand forecast with specific numbers is selling confidence they don’t have. The honest approach is qualitative scenarios - genuinely different futures. In one, AI delivers transformative productivity and new sectors emerge. In another, productivity gains outstrip demand growth, creating structural surplus in commodity stock. In a third, the Jevons paradox catalyses broader expansion. In a fourth, the US-style jobless boom becomes structural - output growing, employment stagnant.
No spreadsheet helps you choose between these. What helps is understanding the forces, tracking the signals, and building resilience across multiple futures.
THE SUPPLY TRAP
There’s a temptation, particularly for landlords and investors, to look at the current supply picture and take comfort. There is already a well-documented shortage of the kind of space the best occupiers want - high-specification, ESG-compliant, well-located, operationally excellent. In many UK markets, occupiers are being pushed to second-best options because the best simply isn’t available.
But relying on supply constraints to fill your building is increasingly risky. AI doesn’t just change how much space firms need - it makes hybrid and distributed working progressively easier and more effective. As thetools for asynchronous collaboration, AI-synthesised meeting outputs, and rich shared context improve, the compulsion to be in a specific physical space diminishes. The occupier who accepted your second-best building because their first choice was full might, in three years’ time, decide they don’t need a central office of that size at all.
Supply constraints are a short-term tailwind. They are not a strategy.
WANT BEATS NEED
This brings us to what I think is the most important strategic question in office real estate right now - and it has nothing to do with task decomposition models.
The #SpaceAsAService era has already demonstrated that selling to someone who needs your product is fundamentally different from creating something someone actively wants. The entire trajectory of operational intensity in the office sector - the rise of flexible space, managed offices, hospitality-influenced design, amenity-rich environments - reflects this shift. Just building to spec is no longer enough.
AI accelerates this. If the processing, analysis, and document production that currently fill desks get absorbed by AI, the purpose of the office shifts further toward collaboration, client relationships, mentoring, culture-building, and the irreducibly human work that remains. Space that serves those purposes will be wanted regardless of macro demand trends. Space that’s still designed for rows of people doing information processing will not.
For developers and investors, this means every asset decision needs to start with a question that no macro model can answer: when this building is ready, what will companies want from their workspace? Not what will they need - because need is declining. What will they choose? What will they pay a premium for? What will make them pick your building over the increasingly viable alternative of not having an office at all?
You can still win big in a shrinking market if you’re building something people choose rather than something they’re forced to occupy. But it requires understanding what work is becoming - not just how much of it there is.
Relying on aggregate demand to fill your building is a bet on a macro variable you can’t control and increasingly can’t predict. Building something people actively desire is a bet on quality, experience, and understanding the future of work.
That’s a better bet.
CRE: Constraints, Moats and Value
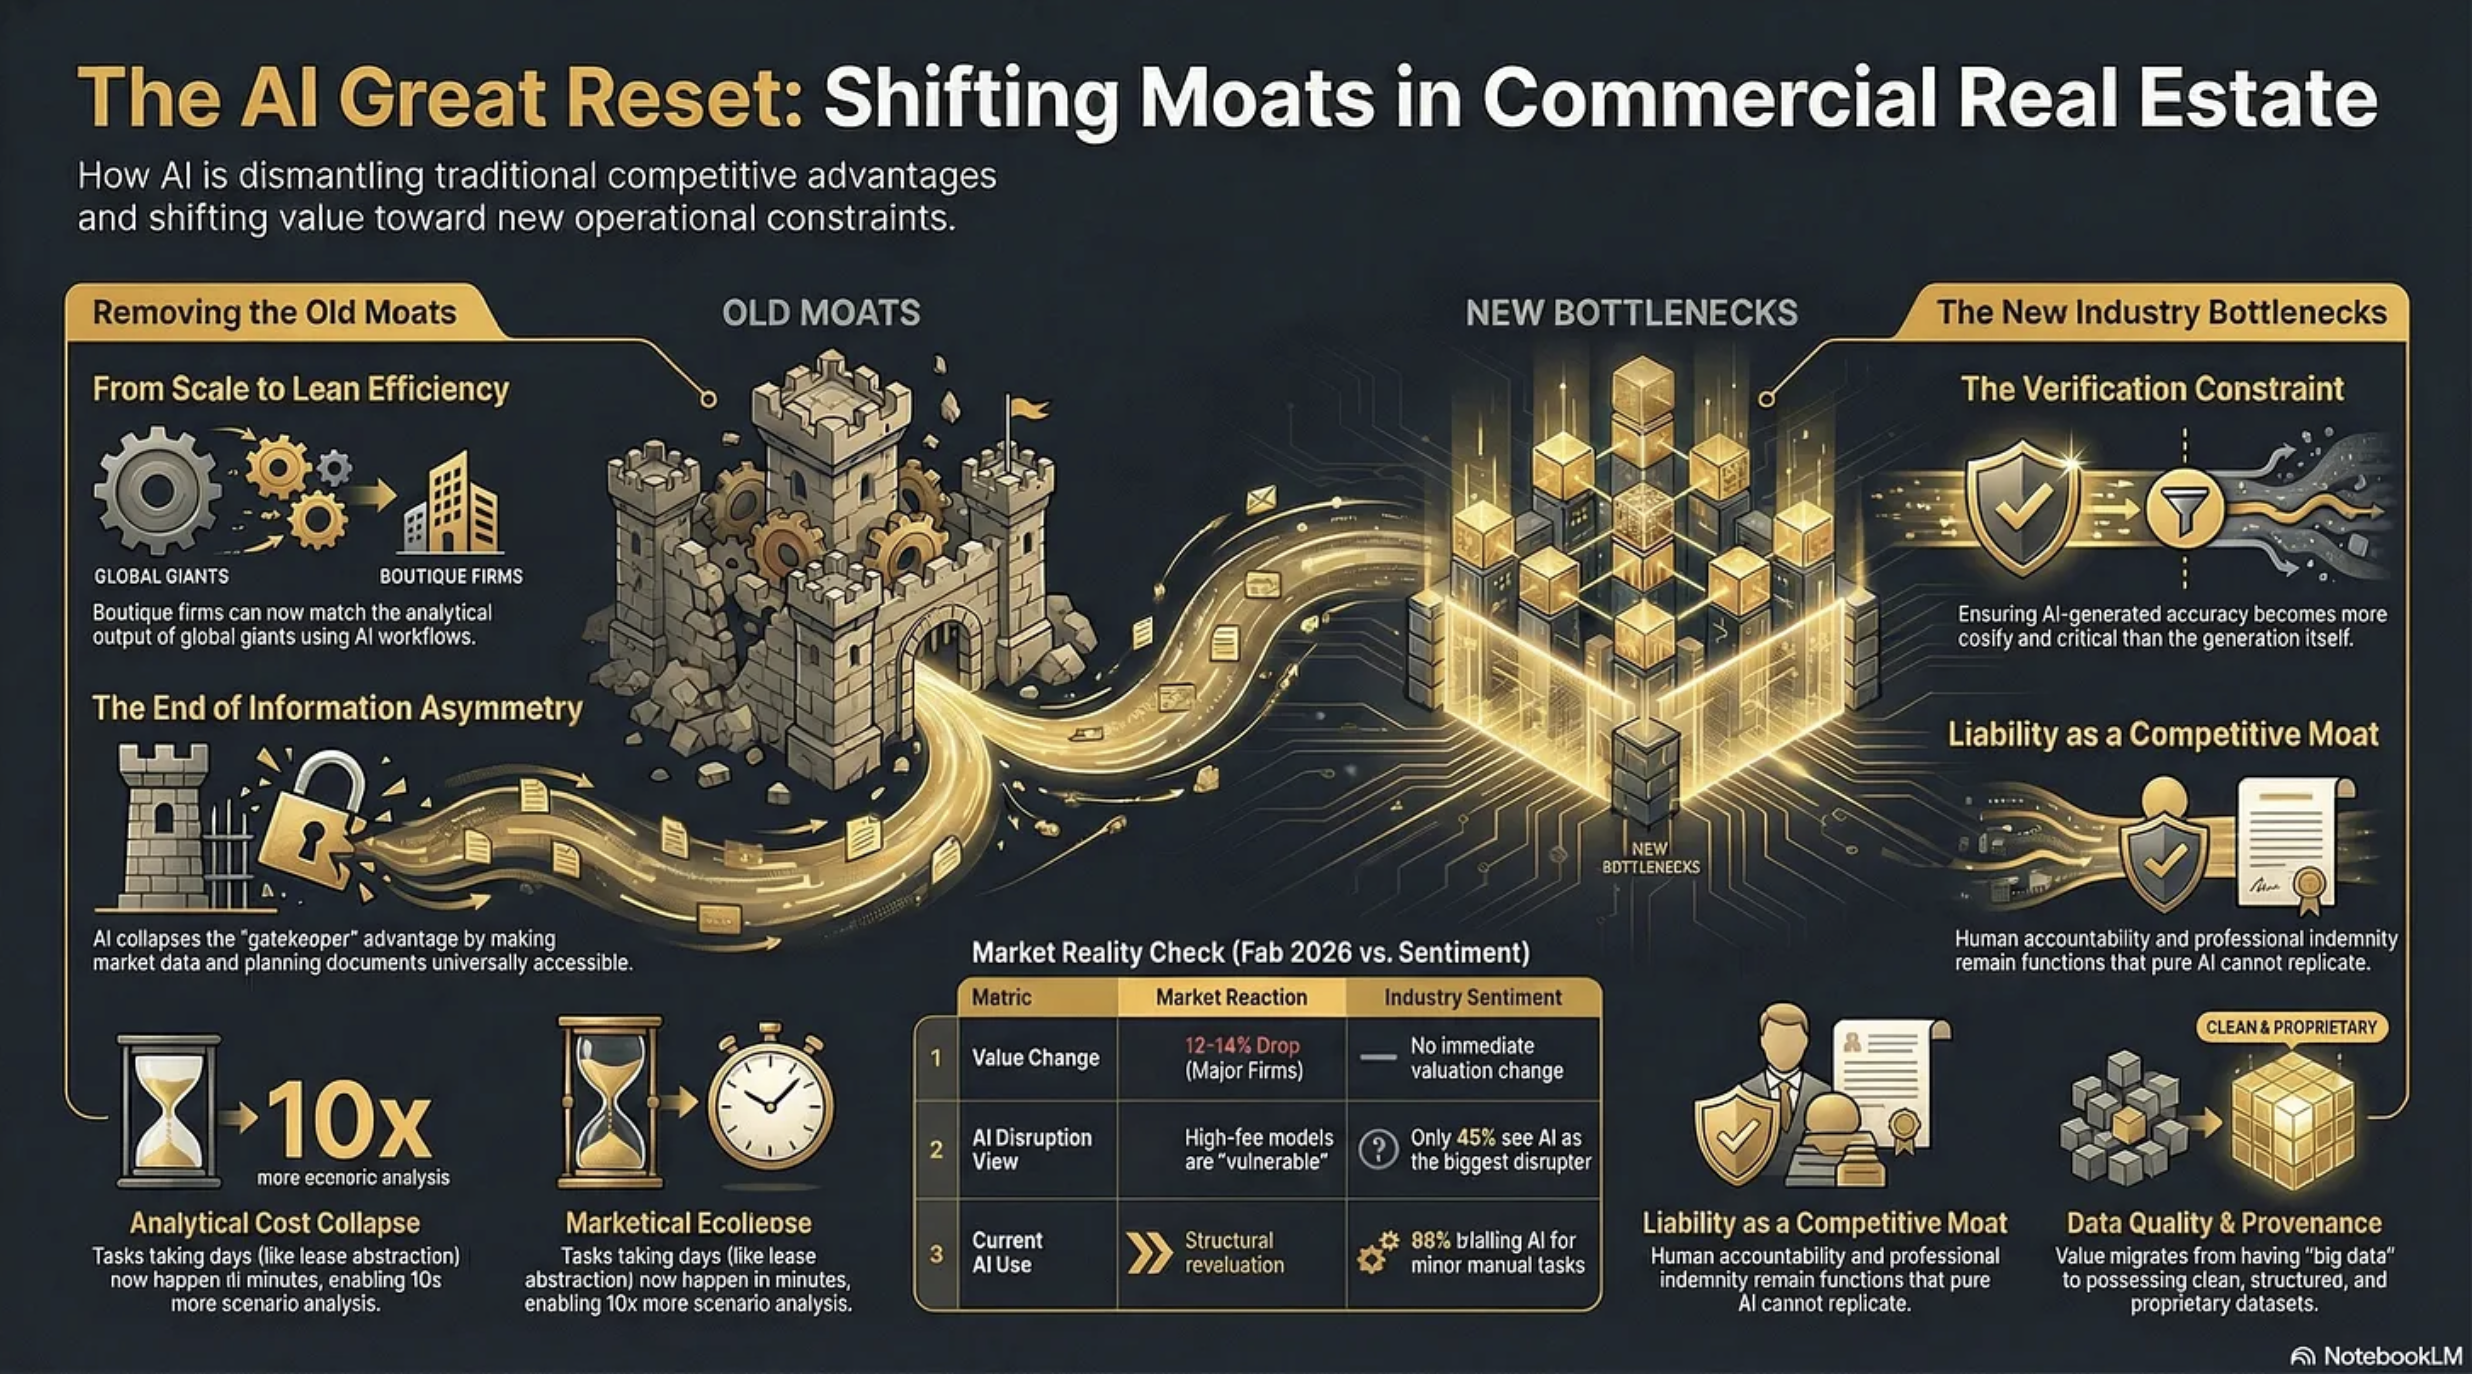
AI is removing the constraints that built CRE’s moats. What replaces them?
Two rather contradictory things happened on Wednesday, 11th February, 2026. First, shares in CBRE, JLL and Cushman & Wakefield fell precipitously on Wall Street, erasing circa 12-14% of their value. The consensus reason?
“We believe investors are rotating out of high-fee, labor-intensive business models viewed as potentially vulnerable to AI-driven disruption”
And then, on exactly the same day, PropTech giant Yardi put out a research report alongside the Association of Real Estate Funds (AREF) ‘examining how the real estate investment industry is responding to operational pressures through technology, data and digital transformation.’
Matt Glenny, commercial and investment management director at Yardi, describes the findings this way:
“The report gives us a real insight into the perception of the real estate industry compared to a lot of the hype that we hear. Just 45% of respondents see AI as the biggest tech disruptor of the next three to five years”
He adds that…
“88% of respondents are trialling AI in some form to automate or enhance performance of manual tasks such as reading and summarising documents and automating meeting minutes. Predictive analytics and the adoption of AI agents are viewed as future aspirations rather than a current consideration.”
So, the market and the industry are pointing in opposite directions.
Who is right?
Sangeet Paul Choudary, senior fellow at the University of California, Berkeley has written:
“New tech collapses old constraints. Once a constraint disappears, the logic of competitive advantage and business model design must be reimagined from first principles.”
If this is so then we need to look at what constraints AI is removing, what new ones it will impose, and how defensible are the moats underpinning current profitability within the CRE professional services industry.
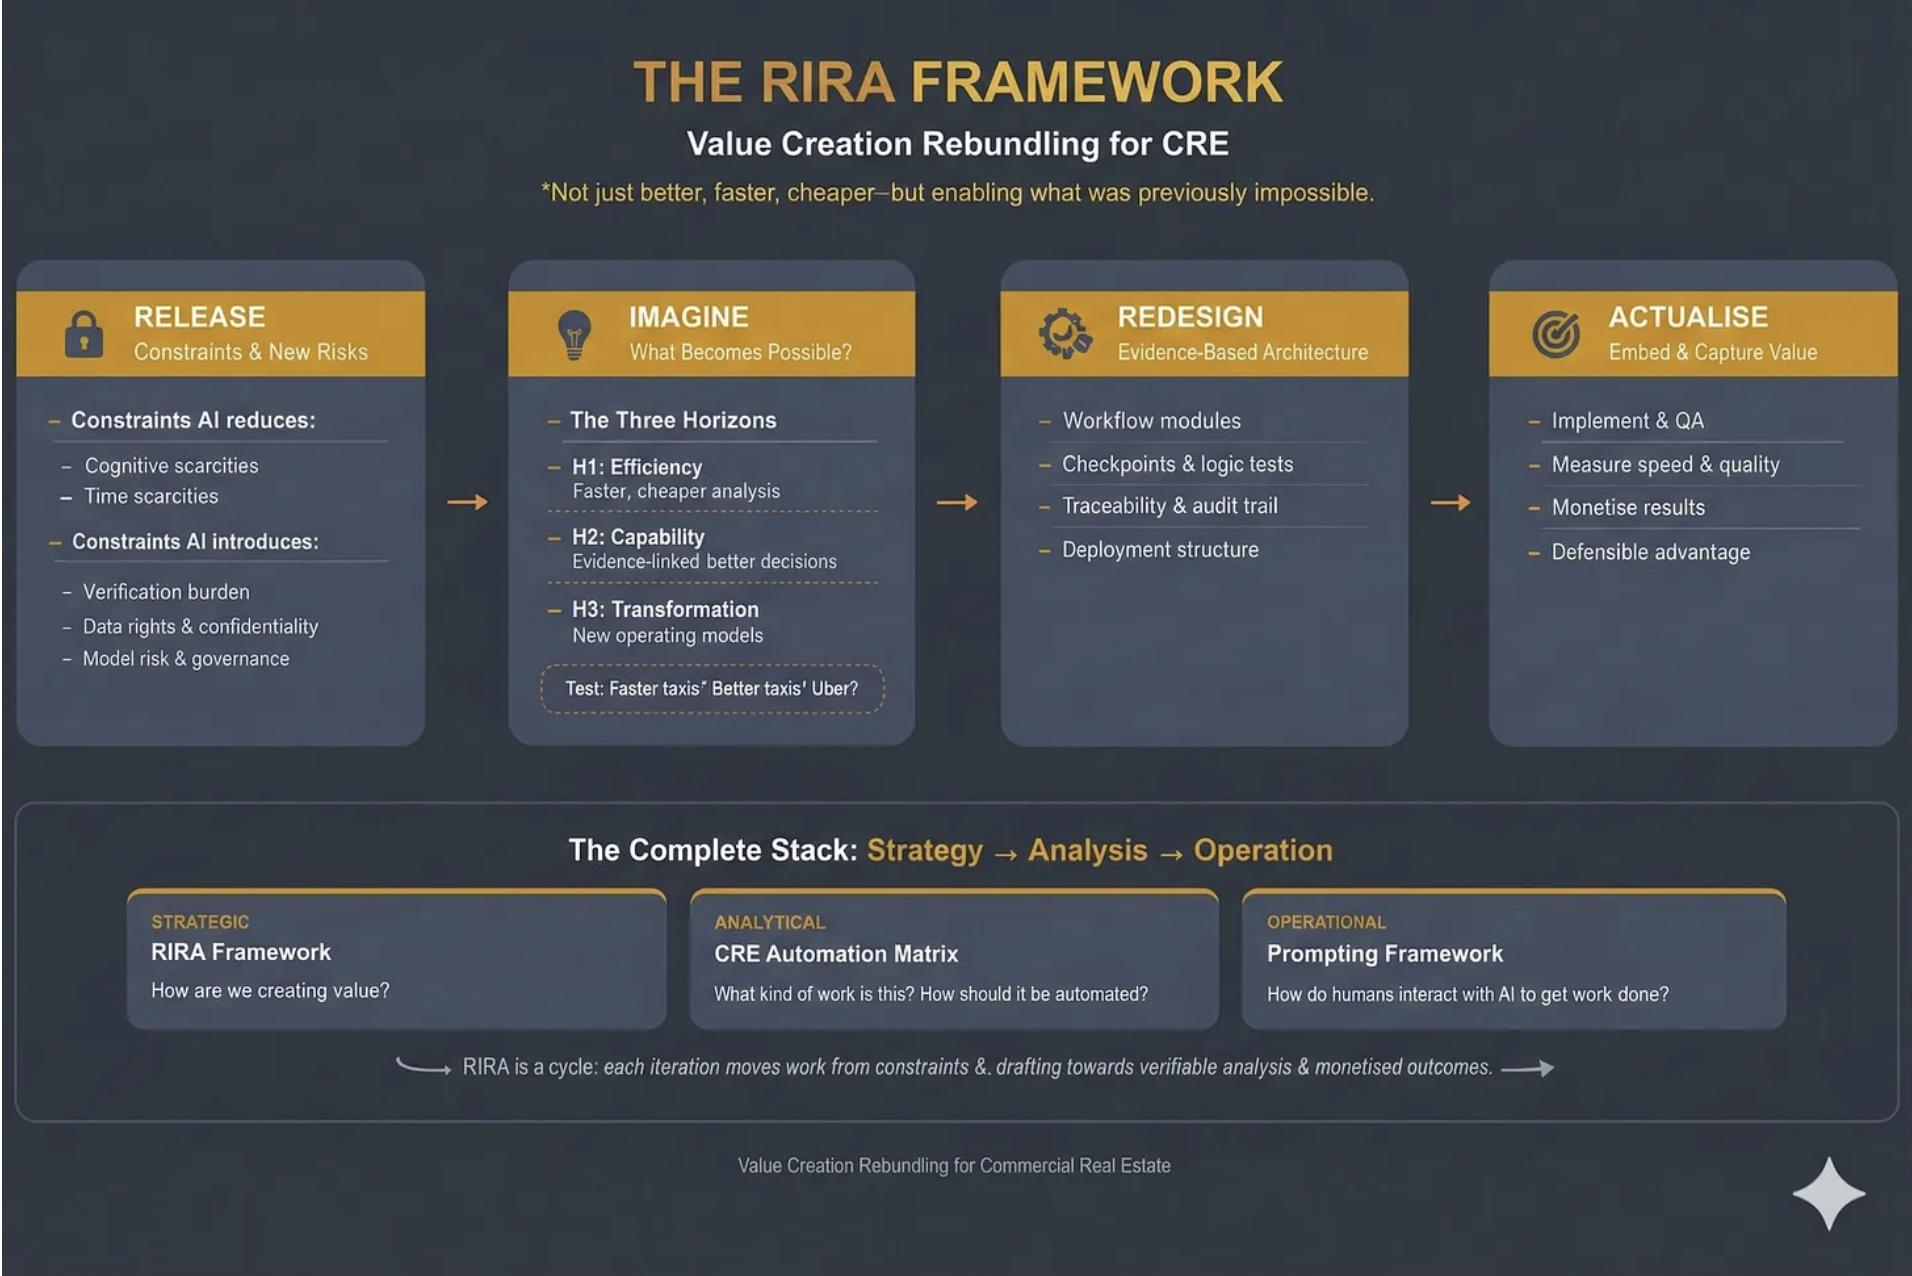
What follows demonstrates the ‘Release’ phase of our RIRA Framework. Starting with…
CONSTRAINTS AI REMOVES IN CRE
Analytical Cost
Tasks that previously required teams of analysts working for days - lease abstraction, comp analysis, market research, financial modelling, due diligence document review - can now be performed in minutes. This makes existing work cheaper and, perhaps more importantly, it makes previously uneconomic work viable. The “non-consumption” opportunity is real: firms can run 50 scenario analyses where they previously ran 3, or screen 200 properties where they previously screened 20.
Knowledge Access
Information asymmetry - knowing things that clients and competitors don’t - has historically been a core source of CRE value. AI though will collapse this by making market data, comparable transactions, planning documents, and regulatory frameworks accessible to anyone with a well-structured prompt. The gatekeeping function that sustained brokerage margins will erode when the information itself becomes abundant. Proprietary data will exist, and still have considerable value, but far more information will become accessible than many realise.
Coordination
This is perhaps the least appreciated constraint that is being removed by AI. CRE transactions involve coordinating across multiple parties - lawyers, surveyors, lenders, agents, asset managers - each operating within their own systems and timelines. AI can interpret across these disparate data sources without requiring standardisation or consensus, compressing transaction timelines and reducing the friction that historically justified intermediary fees.
Talent Scaling
This is a fundamental constraint that AI is dismantling. A boutique firm with three sharp principals and well-designed AI workflows can now produce analytical output that previously required the likes of CBRE’s headcount. The scale advantage that the big companies enjoyed, hundreds of researchers, analysts, and junior professionals feeding the advisory machine, becomes less decisive when AI handles the analytical infrastructure underneath the senior relationship.
Geographic Knowledge
Deep local market knowledge - planning regimes, tenant dynamics, micro-location factors - has been a genuine moat for regional specialists. AI agents with access to planning portals, EPC data, Land Registry records, and local comparable evidence can approximate (not yet replicate) much of this knowledge, reducing the premium that locality alone commands.
CONSTRAINTS AI INTRODUCES
Verification
This becomes the new bottleneck. The more convincing AI outputs become, the harder hallucinations are to spot, and the greater the temptation to skip verification. This is a genuinely new constraint - the cost of ensuring an AI-generated IC pack is accurate may exceed the cost of generating it. Firms that build robust evidence architecture gain a real advantage; firms that don’t take on hidden liability risk.
Liability and Accountability
These create a structural constraint. When a junior analyst produces a flawed valuation, there’s a clear chain of professional accountability. When an AI system produces one, the liability question is genuinely unresolved. Professional indemnity, regulatory compliance, and fiduciary duty all sit awkwardly with AI-generated outputs.
However, this means that liability can become a moat. In knowledge work with ambiguous outcomes, absorbing liability remains a function that pure AI tools cannot perform.
Data Quality and Provenance
These constraints intensify. AI systems are only as good as their inputs, and CRE data remains fragmented, inconsistent, and often proprietary. The firms that have clean, structured, proprietary datasets gain compounding advantage. Those relying on the same publicly available data as everyone else will find their AI outputs commoditised immediately.
Governance and Workflow Design
These become a constraint on deployment speed. It’s not enough to have capable AI - you need checkpoints, audit trails, escalation protocols, and quality assurance routines. Building this infrastructure requires architectural thinking that most CRE professionals haven’t had to do before. The firms that solve the governance problem will be able to deploy AI at scale; the rest remain stuck in pilot purgatory.
Cognitive Dependency
This risk emerges as a longer-term constraint (though I believe a major one in the making). As professionals offload analytical tasks to AI, the institutional knowledge that informed those tasks atrophies. Junior professionals who never learn to build a model from scratch may lack the judgement to evaluate whether an AI-generated model is sound. Designing workflows and systemic methodologies to counter cognitive dependency will become a major requirement in knowledge businesses. I address this at length in my ‘Cognitive Sovereignty - Use It or Lose It’ article:
WHY CONSTRAINT MAPPING MUST BE WORKFLOW-SPECIFIC
These are generic constraints that are being removed or introduced across the CRE industry. They’re structural features of what AI does to knowledge work.
But the weighting differs enormously, and analysing them in relation to particular workflows is vital.
Consider the contrast between investment capital markets and property management. In capital markets, the information asymmetry constraint has historically been central to value creation, knowing about off-market deals, having proprietary comp data, and understanding institutional investor appetite. AI’s collapse of that constraint is existential to the business model.
In property management, information asymmetry was never the primary value driver: the constraints that matter are physical presence, emergency response capability, tenant relationship management, and regulatory compliance around health and safety. AI removes some PM constraints (reactive maintenance scheduling, compliance tracking, tenant communication at scale) but leaves the physical and relational constraints largely untouched.
Or compare valuation with development advisory. Standardised valuations face near-total constraint removal, AI can assemble comparables, model cash flows, and produce RICS-formatted reports with diminishing human input. Against that, on the new constraint side, there will be a need for professional sign-off and PI liability.
Other areas of the industry will be largely untouched by AI. Development advisory, for example, faces an irreducible constraint in planning committee politics, local authority relationships, and community engagement. The constraint AI does remove for development (planning application analysis, precedent search, viability modelling) is important but secondary to the human-political constraint that gates every project.
Then there’s leasing, where we’re seeing constraint-swaps. In the US, in multi-family, pricing has had constraints removed but that in turn has created a new legal constraint and we’re seeing several companies being sued over the ‘coordination’ of algorithmic pricing. That constraint doesn’t appear in capital markets or valuation work at all. It’s a constraint born from the interaction of AI capability with a specific regulatory environment (which arguably should have been anticipated).
So the constraint map - which constraints dominate, which are secondary, and critically, how they interact - has to be workflow-specific. And the interactions are where the real insight lives. Which is why our RIRA Framework has ‘Release’ as the first ‘R’ - you need to understand the new constraints that are appropriate to your specific workflow, or sector.
What is absolutely clear though is that AI is fundamentally changing the environment in which our businesses operate, and this in turn means that many of the moats we’ve relied on in the past might no longer exist.
THE FALSE MOATS
The Yardi/AREF report, together with Linkedin commentary on the stock price erasure, and pronouncements during earnings calls, make it clear that many in the industry believe CRE has special protection from several ‘moats’ that make it distinctive from other industries, and more defensible against AI.
These need to be addressed:
“Our relationships are our moat.”
Relationships are real, but their defensive value depends heavily on what those relationships enable.
If a client relationship primarily gives access to deal flow and information, AI erodes the information component. The relationship remains valuable, but the fee it commandscompresses because the analytical work underneath it requires less human capital.
The relationship is a moat for the individual, not necessarily for the firm’s margin structure. And crucially: relationships don’t scale, which means they can’t offset margin compression across the broader business.
“Our data is our moat.”
This is half-true, which makes it dangerous. The major companies do have proprietary transaction data, but much of it sits in unstructured formats, inconsistent taxonomies, and siloed systems. Having data and being able to use data as a strategic asset are very different capabilities.
Meanwhile, AI dramatically lowers the cost of assembling comparable datasets from public sources - Land Registry, planning portals, EPC databases, Companies House. The proprietary data advantage is real but narrower than assumed, and it’s a wasting asset if competitors build structured alternatives faster.
“Complex deals require human judgement.”
The definition of “complex” has been a moving target for decades (spreadsheets killed some complexity, databases killed more). What counted as requiring senior judgement five years ago (multi-scenario cash flow analysis, market positioning reports, tenant covenant assessments) is already within AI’s capability.
The residual, true strategic judgement under genuine uncertainty, is real but represents a much smaller slice of billable activity than the industry likes to admit. Is it more than 15%? Most of what brokers call “judgement” involves pattern recognition applied to structured data, which is exactly the capability profile where AI is advancing fastest.
“Regulatory complexity protects us.”
CRE is indeed heavily regulated; RICS standards, planning law, lease code compliance, environmental regulations. But regulation protects the activity, not the incumbent. AI systems that can navigate regulatory requirements more reliably than human professionals don’t erode the regulatory constraint - they erode the premium charged for managing it. Regulation becomes a moat only if firms combine it with liability absorption and governance credibility.
“Our brand and institutional trust are our moat.”
For trophy transactions - the £500m office acquisition, the major corporate relocation - institutional brand matters. Clients want CBRE or JLL on the cover page for their board. But this protects the top 5-10% of transactions by value. For the long tail of mid-market deals, where the analytical quality matters more than the logo, brand becomes less decisive as AI enables smaller firms to produce institutional-grade output.
“Scale is our moat.”
This is the one Wall Street is actively repricing. Scale was a moat when it provided analytical capability that couldn’t be replicated without hundreds of researchers. AI inverts this as it makes scale available to the lean.
It’s not hard to envisage a five-person firm with well-architected AI workflows producing the analytical throughput that required a 40-person team three years ago.
When technology collapses the constraint that justified your architecture, the architecture itself becomes a liability. The big companies’ headcount, which was their competitive advantage, becomes their cost structure problem.
THE MEANING FOR VALUE CREATION
So if AI is removing constraints, and creating new ones, and the industry’s moats are leaking fast, what does this mean for value creation?
The CRE industry is mistaking a stable playing field for a permanent one. Furthermore, it is thinking about how AI will support its existing operating models, rather than thinking about how to fundamentally change the game.
Last week the CEO of one of the major players said on an earnings call:
“that AI would benefit the business over the longer term, adding that its transaction and investment work would be “most protected” from disruption.”
Which encapsulates this thinking precisely.
The share price crash is the market, brutally and without nuance, beginning to price a structural revaluation into this sector. What the industry now needs to do is double down on understanding where value is migrating to. As analytical and transactional work commoditises, value will migrate to whoever resolves the new constraints - verification, liability, governance, and coordination.
Exactly what this means in terms of products and services is still to be determined. But by diving deep into the first ‘R’ in the RIRA framework, the map starts to become more like the territory, allowing us to better agree with or dismiss most of the ‘noise’ around CRE and AI today.
What is clear is that we have to think harder about where AI is taking us, and explain this precisely to the markets. The competitive advantage will accrue to those who can demonstrate why AI is a feature, not a bug. How many will manage that?
OVER TO YOU
What to do about all of this? What’s the strategic question you should be asking that you’re currently not?
The PropTech Apocalypse
And why you need RIRA
Summary: Over $300 billion in software market value was erased in a single day. This piece explains why - and what it means for commercial real estate. Using the RIRA framework applied to an investment deal workflow, I show how AI is swapping old constraints for new ones, where value is migrating, and why the firms that own the data layer and the execution layer will capture the next cycle’s profits. It’s a long read. It’s meant to be.
Over the last three weeks I’ve introduced three frameworks - the CRE Automation Matrix, Prompting for CRE Professionals and the RIRA (Release, Imagine, Redesign, Actualise) Framework itself. This week I want to show you RIRA in action, as an example for how it can be incorporated throughout your business.
But first, let’s talk about what happened on Wall Street at the start of February.
$300 Billion Erased
February opened with a software massacre.
On Tuesday the 3rd, according to Forbes, over $300 billion in market value was erased from the software sector in one trading day
“Several of the most entrenched enterprise software companies fell sharply in a single day. Salesforce, ServiceNow, Adobe, and Workday each dropped around 7 percent. Intuit fell nearly 11 percent. At the same time, valuation multiples across the sector compressed violently. The average forward earnings multiple for software companies collapsed from roughly 39x to about 21x in just a few months.”
Wall Street called it the “SaaS-pocalypse.“
This was less a random correction and more a fundamental repricing. The market is waking up to something the venture capital world has been whispering about for months: the software model that dominated enterprise technology for two decades is structurally breaking.
The Thesis: Why Software is Being Hollowed Out
The argument is as follows, and it maps onto commercial real estate with uncomfortable precision.
For twenty years, businesses bought software to help humans organise their work. Dashboards. To-do lists. Complex menus. You paid for a “seat” - a licence for your employee to log into a system. The software didn’t actually do anything. It was a digital filing cabinet. Your employee still had to log in, click buttons, enter data, send emails.
You paid twice. Once for the software. Once for the salary of the person operating it.
The thesis is straightforward: if AI can now execute tasks, paying for software that merely organises human tasks is becoming a bad investment. The industry is converging on this from multiple directions - Phil Fersht at HFS Research calls it “Services-as-Software,” a16z frames it as “software eating labour,” I’ve described it as “Outcomes-as-a-Service.” The labels differ but the signal is the same: not tools that assist the user, but systems that replace the user’s labour. Not dashboards that show you what needs doing, but agents that do it.
This creates what I’ve been calling the “barbell effect.” If the middle layer of software - the screens humans look at to manage tasks - is being hollowed out, value migrates to two poles. At one end: the data layer. AI agents cannot function without accurate, structured, proprietary data. Your lease data, payment history, building performance records - these become more valuable, not less. At the other end: the agent layer. Systems that actually execute work - negotiate a lease, dispatch a vendor, rebalance an HVAC system, screen an acquisition.
The middle - standalone CRMs, basic dashboards, static reporting tools, “thin wrapper” applications that put a digital skin on a manual process - gets crushed.
Clayton Christensen’s ‘conservation of attractive profits’ is the key: when a layer commoditises, profits don’t die - they move to adjacent layers where differentiation still matters.
What looked like “$300 billion erased” is the market repricing where future margins will sit: away from software that organises human work, and towards the layers that own the data and execute outcomes.
The question for every CRE professional is: which side of the barbell are you building on?
The question for every PropTech company is: are we facing our own apocalypse, and what can we do about it?
This is where RIRA comes in. As a strategy-to-execution framework for rebundling value creation in commercial real estate under conditions where AI materially changes the unit economics of analysis and content production, it helps you develop new products and services that leverage, rather than are crushed by, AI.
RIRA in Action: The Investment Deal
To demonstrate the process of using RIRA I am going to use the example of ‘The Investment Deal’. How might the way we deal with deals develop in a heavily AI-mediated world?
RIRA, which stands for ‘Release-Imagine-Redesign-Actualise’, is a way of looking at a workflow through four lenses, where each lens depends on the previous one, and the power comes from following the thread all the way through.
I’ve chosen an investment and capital markets workflow because the constraint-swaps at each stage are the most vivid, the evidence is the most concrete, and the implications are the most strategically significant. At the end, I’ll sketch how the same logic applies everywhere else.
Release: The Analyst Bottleneck Dissolves - and a New One Appears
The Release lens is about what constraints AI removes, and which new constraints it introduces.
Every acquisitions professional knows this workflow intimately. An Offering Memorandum arrives. A junior analyst extracts data from the PDF. Types it into Excel. Massages the assumptions. Builds an ARGUS model. Runs comps. Drafts an Investment Committee memo. Repeat.
A typical CRE acquisition consumes 30–50 analyst hours on data extraction alone. Deal volume is capped by how many OMs a human team can physically process. Firms miss opportunities not because the deals aren’t there, but because they lack the manpower to review them.
AI tools are already releasing this constraint. We are seeing tools (vendor-reported) that generate full five-year cash flow models and IRR analyses in under five minutes with (allegedly) 99%+ extraction accuracy. Others that achieve 95% faster approvals with 400% better risk detection than human reviewers. Firms using these tools report handling 3–4× more deals with the same staff. The precise numbers warrant scrutiny - vendor benchmarks rarely survive contact with messy, real-world portfolios - but the direction of travel is clear.
But, and this is the core insight of the Release stage, AI never just removes a constraint. It swaps it for a new one.
The old bottleneck was throughput: we couldn’t screen enough deals. The new bottleneck is explainability. An Investment Committee cannot approve a £100 million acquisition based on “trust me” from a model. Dealpath, in a recent survey, reports that 93% of institutional firms cite significant AI adoption barriers, with 43% lacking internal expertise. The binding constraint shifts from speed to trust. If the AI cannot show its working - if the outputs aren’t auditable, traceable, and defensible - the speed is worthless.
Data quality becomes an equally hard constraint. If the underlying data is fragmented or dirty, the AI will confidently produce bad returns. “Clean data” becomes the new prerequisite for speed.
Diagnostic question: If we could screen ten times as many opportunities tomorrow, what breaks first - governance, explainability, data quality, decision rights, or IC bandwidth? That’s the new binding constraint, and it’s where execution will stall unless you redesign around it.
Imagine: The 24/7 Deal Hunter
The Imagine lens is about what becomes possible, given the new technologies at your disposal.
If the marginal cost of intelligence drops to near zero, what becomes possible?
Across three horizons: H1 for what becomes more efficient, H2 for what new capabilities can we develop, and H3 for what transformation is now possible?
Think taxis - they could be faster, or maybe they could accept credit cards or… well they could become Uber.
Imagine an investment firm where no human performs data extraction. A sourcing agent continuously monitors thousands of inputs - public listings, court filings for distress, planning/zoning changes, demographic shifts, permit applications. It doesn’t just search. It reasons. It holds the firm’s specific investment thesis - “value-add multifamily in growth markets with strong transport links” - and when it identifies a potential asset, it performs a preliminary underwrite. It ingests the rent roll regardless of format, maps it to the firm’s chart of accounts, pulls real-time tax and insurance comps, and runs a ten-year DCF. The human principal receives a deal memo only for assets that clear the IRR hurdle.
If we could combine market intelligence, debt capacity analysis, and portfolio fit scoring in a single system, and run it autonomously, 24/7/365, we’d have enabled something pretty special. Are we there yet? No, but the likes of JLL (building on the skyline technology they bought a few years ago) and Cherre, building on their years of data wrangling, are getting there.
The critical distinction: this isn’t “a better dashboard.” It’s the elimination of the entire analyst-receives-OM → manual-data-entry → build-ARGUS-model → manual-comp-research → IC-memo workflow. The human enters at the judgement stage, not the extraction stage. The role of the analyst doesn’t disappear - it transforms from “data processor” to “decision validator.”
Design question: If the marginal cost (and time) of analysis and execution tends toward zero, what should we now do that we currently don’t - because it was previously uneconomic or too slow? Where should the system run 24/7, and where should humans enter purely for judgement, not extraction?
Redesign: Dismantling the Excel Industrial Complex
The Redesign lens is about building an evidence-based architecture for new workflows.
The Imagine stage showed us the destination. The Redesign stage is the engineering - how do we physically rebuild our data and workflows to get there?
The core problem has a name that every CRE professional will recognise: the Excel Industrial Complex.
Today, an investment model is a spreadsheet. The moment that file is saved, it is dead. It is a snapshot in time that does not update when interest rates change, a tenant vacates, or the market moves. When you want to test a new scenario, someone manually changes the inputs and saves a new version. Knowledge lives in filenames: “Model_v7_FINAL_FINAL_JB_edits.xlsx.”
The Redesign phase replaces this with what I’d call a Live Financial Twin - an investment model that is a living software object connected to the market.
Underneath that sits the real asset: the canonical deal graph - a structured schema that captures asset terms, counterparties, risks, covenants, and underwriting assumptions as first-class objects, not cells in a spreadsheet. Crucially, it preserves model lineage: every assumption and output is traceable back to source evidence (the specific clause, rent roll line, comp, rate series, or email confirmation) with an auditable chain of custody.
This is where you’d map the workflow against the CRE Automation Matrix — identifying which components are candidates for full automation, which need human-in-the-loop gates, and which remain irreducibly human judgement.
The architecture would have three layers. First, an ingestion layer: OCR and NLP tools ingest documents - rent rolls, tax bills, service charge packs - and convert them into structured data objects, not spreadsheets. Second, live connections: the model is connected via API to real-time market feeds. If the ten-year gilt yield moves, the model automatically updates the cost of debt and recalculates the IRR. You don’t wait for an analyst to notice. Third, write-back capability: when a decision is made - “approve budget,” “proceed to exclusivity” - it doesn’t just sit in meeting minutes. It writes back to the accounting system and updates the forecast automatically.
But notice the new constraint this introduces. If the model is live and automated, you need verification architecture that didn’t previously exist. You need what some are calling “Auditor Agents“ - secondary models whose sole job is cross-checking the maths and logic of the primary underwriting agent. You need human-in-the-loop gates at specific decision points. You need an audit trail that can satisfy both your IC and your regulators.
This is where the barbell becomes concrete. The value accrues to whoever owns the “canonical deal graph“ - the structured, permissioned, auditable data layer - and its agent interfaces. Not to whoever has the prettiest dashboard.
Engineering question: Where are we relying on humans to bridge systems - and what would it take to replace those bridges with a canonical deal graph and auditable model lineage tied to source evidence?
Actualise: From Effort to Edge
The Actualise lens is about embedding and capturing value - turning capability into competitive advantage and revenue.
The first three stages created capability. The Actualise stage answers the question that matters most: how do we capture the value, and how do we stop it leaking to competitors?
Start with what’s changed about what you’re selling. The traditional investment advisory model charges for effort - analyst hours, transaction fees, AUM-based management fees that are proxies for headcount. But if the workflow you’ve redesigned can screen ten times the deals with the same team, the effort-based model actively penalises you for being good at this. You did the work in three minutes; you can’t credibly bill for thirty hours.
The business model has to shift from charging for effort to charging for outcomes: time-to-decision, risk-adjusted conviction, deal throughput, yield improvement. This isn’t a cosmetic change. It requires rethinking fee structures, incentive alignment, and how you demonstrate value to LPs and Investment Committees. But it’s also where the margin expansion lives. The firms that cling to effort-based billing in an AI-accelerated world are subsidising their competitors’ transition.
Next, recognise where the moats actually form. If you’ve built the architecture described in the Redesign stage - the canonical deal graph, live financial models, auditable lineage - you now own something that compounds. Every deal screened enriches the dataset. Every assumption validated sharpens the model. Every IC decision recorded becomes training signal. A competitor starting today doesn’t have your technology and they lack your years of structured deal intelligence. This is the data flywheel, and it is the deepest source of defensibility in the new landscape. It is conservation of attractive profits made concrete: the proprietary data layer becomes the locus of value.
Finally, look for the profit pools you didn’t plan for. Well-architected data infrastructure generates optionality. A firm that built audit-grade, real-time performance data for underwriting purposes discovers it can also price transition risk more accurately than peers, or license anonymised benchmarking data, or offer LPs portfolio-level transparency that compresses their cost of capital. These adjacent opportunities weren’t the original design objective but they are emergent properties of having built the data layer properly. The firms that capture them are the ones that recognised their data infrastructure as a platform, not just a workflow tool.
Business model question: Where are we still charging for effort (hours, seats, process friction) when the value we deliver is actually an outcome (risk reduced, yield improved, time-to-decision shortened)? And which datasets are we generating today - currently treated as operational exhaust - that could become compounding advantage if captured, structured, and reused?
RIRA AS FLYWHEEL
I’ve presented these stages sequentially because that’s how writing works - you read one section after another. But RIRA isn’t a linear process. In practice, you’ll find that the Redesign stage surfaces constraints you didn’t identify in Release. The Actualise stage reveals profit pools that send you back to Imagine with new questions. The framework is iterative by design — each pass through it sharpens your understanding of where value is forming and where it’s migrating. The power isn’t in completing four stages; it’s in the quality of the loops between them.
For instance, when you reach the Redesign stage and discover that your data architecture requires auditor agents and human-in-the-loop gates, that’s a new constraint — which sends you back to Release with a sharper question. And when Actualise reveals that your underwriting data could be licensed as a benchmarking product, that’s a new possibility — which sends you back to Imagine with a business model you hadn’t considered. The framework tightens with each pass.
And because the framework adapts to whatever constraints a given domain surfaces, the same iterative logic applies well beyond investment deals.
The RIRA Pattern Holds Everywhere
I chose the investment deal because the constraint-swaps are vivid, the evidence base is deep, and the stakes are high enough to hold your attention. But the logic isn’t specific to capital markets. It’s structural.
Every CRE workflow has a binding constraint that AI is about to release. Every released constraint produces a new one that nobody was planning for. Every new possibility demands redesigned architecture. And every redesigned architecture creates value that migrates somewhere - the only question is whether it migrates to you or away from you.
Take leasing. The released constraint is responsiveness - business hours, language barriers, the sheer friction of human-to-human scheduling. EliseAI already automates 90% of prospect interactions across 70% of the top 50 US rental operators. That’s a real number, today. But follow the thread. The new constraint isn’t technological, it’s regulatory. When algorithms optimise pricing and availability across an entire portfolio, you’ve crossed from operational efficiency into territory that regulators recognise as market coordination. The US Department of Justice’s lawsuit against RealPage is the canary. The firms that saw leasing automation purely as a cost play, without redesigning their compliance and governance architecture, are now exposed to a constraint they never anticipated. Release → new constraint → architectural consequence. The pattern holds.
You can run this logic through facilities management, asset management, development, valuation, property management - any workflow where humans currently bridge between systems, interpret data, or make routine decisions under time pressure. The binding constraints differ. The new constraints that emerge will differ. The architectural responses will differ. But the sequence is invariant, and that’s what makes RIRA a framework rather than just a case study.
If you’re wondering how RIRA applies to your specific workflow - leasing operations, portfolio strategy, facilities management, tenant experience - that’s precisely what we work through, step by step, in my forthcoming course. The investment deal example gives you the logic. Applying it to your own context is where the value compounds. It’s also where the non-obvious constraints - the ones that only surface when Release, Imagine, Redesign and Actualise interact - tend to catch firms out. Contact me for details.
The Takeaway
The $300 billion that was erased from software stocks is a signal, not an anomaly. Value is moving. It’s moving from tools that organise human work to systems that execute it. From dashboards to data layers. From seats to outcomes.
Christensen was right: when one layer commoditises, attractive profits don’t die - they change address.
And in this cycle, they’re migrating towards data ownership and execution.
The RIRA framework is a way of thinking clearly about where it’s moving in your specific context - and making sure you’re building on the right side of the barbell when it arrives.
And a way for PropTechs to avoid their own apocalypse. Or at least see it coming.
You need to prompt with skill
No matter who you are, quality prompting has a high ROI
A Prompting Framework for CRE Professionals:
In the first part of this series we looked at RIRA- a strategy-to-execution framework for rebundling value creation in commercial real estate under conditions where AI materially changes the unit economics of analysis and content production. And last week we looked at ‘The CRE Automation Matrix Framework’ - a tool for understanding where value is moving to, what to automate, and how. This week we introduce ‘A Prompting Framework for CRE Professionals’, showing how effective prompting is a repertoire matched to domain expertise, AI fluency and task mode.
Together these frameworks form a set of foundational tools for maximising the impact, and leverage, of AI on any business.
THE EVIDENCE
Anthropic, makers of the frontier AI model Claude recently published their fourth ‘Economic index Report’, in which they show that people who can articulate complex, nuanced requirements in a prompt get complex, nuanced outputs. AI amplifies existing expertise rather than substituting for it. The ROI gap between a team that knows how to prompt well and one that doesn’t is enormous.
So if you have domain expertise, and prompting expertise, you will gain the most from current AI.
What This Framework Is
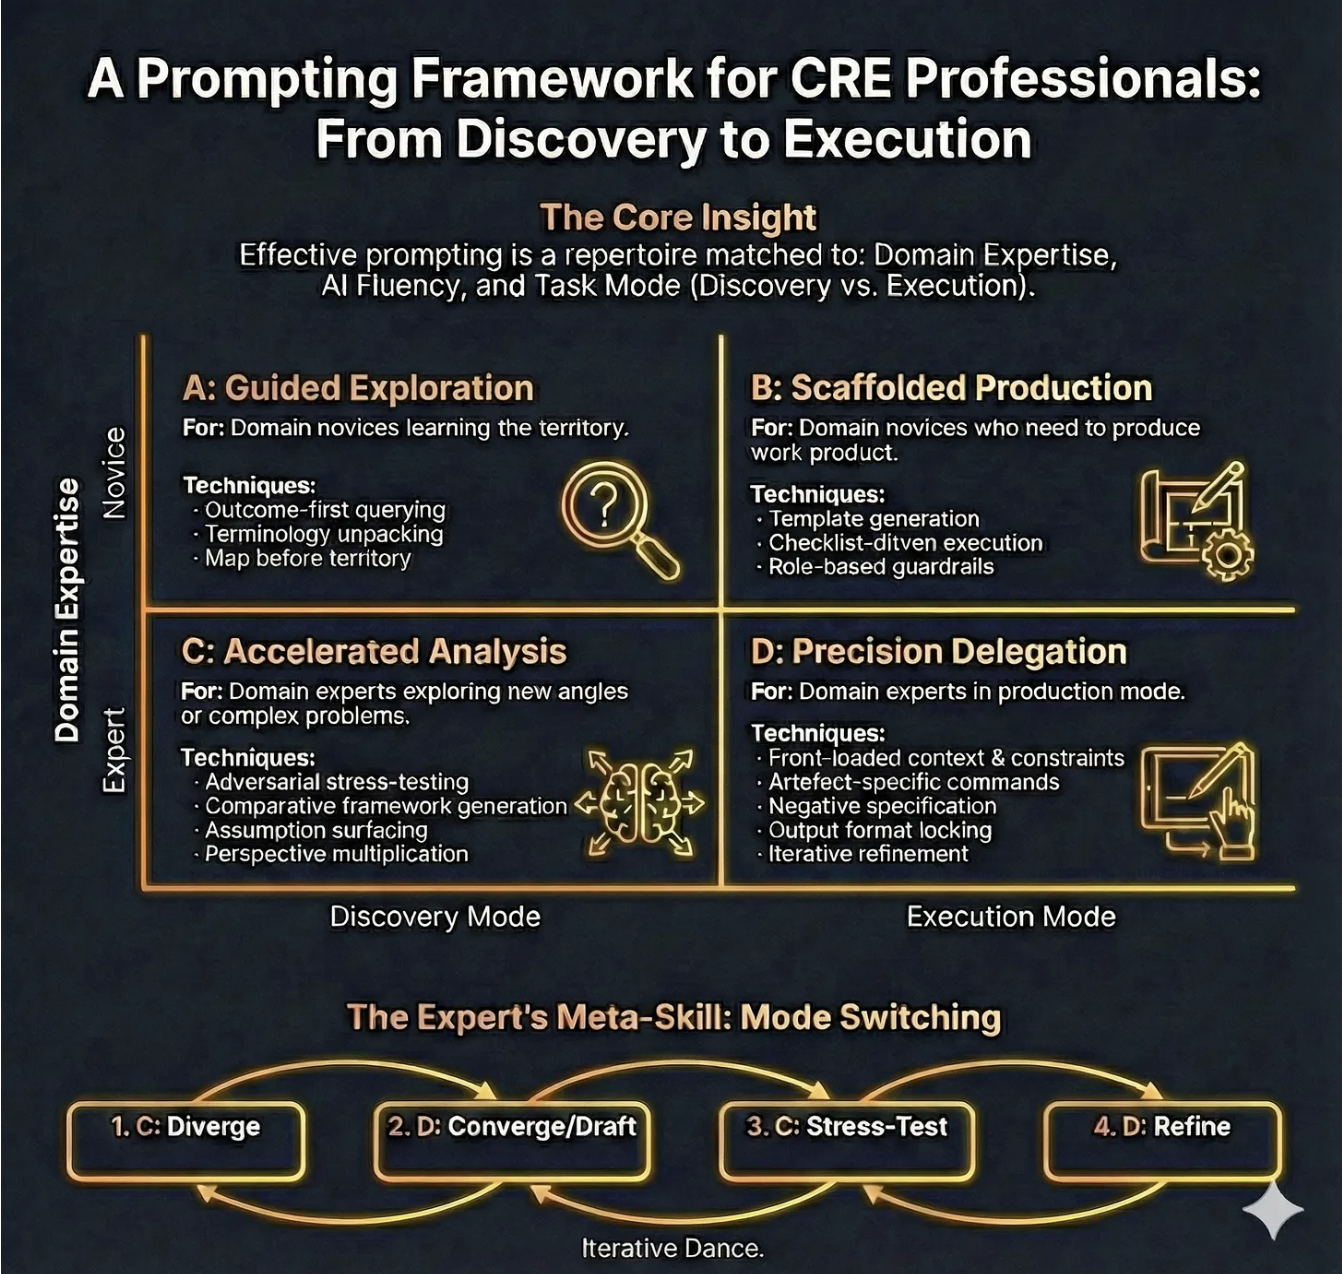
The ‘Prompting Framework for CRE Professionals’ is a practical framework for choosing how to prompt based on two realities of professional work:
(1) your domain expertise is relative to the problem you’re facing (you can be an “expert” in offices and a “novice” in data centres)
(2) your task is either Discovery (sense-making, shaping the problem, exploring options) or Execution (producing a deliverable under constraints).
The framework maps these two variables into four prompting modes - A, B, C, and D - and adds an expert loop (“Mode Switching”) that deliberately alternates between divergent analysis and convergent drafting to produce better work with fewer avoidable errors.
Why it matters: the Strategic Problem AND What Goes Wrong Without It
Most AI misuse in commercial real estate is not “people using the wrong model”. It’s people using the wrong prompting mode.
Without a mode choice:
You treat Discovery like Execution: You ask for an “IC pack” before you’ve clarified the investment thesis, risk boundaries, and decision criteria.
The Result: a polished document that is directionally wrong - high credibility veneer, low decision usefulness.You treat Execution like Discovery: You stay in brainstorming indefinitely, generating option overload and never landing a decision-ready artefact.
The Result: time sink, “AI theatre”, and stakeholder impatience.Novices over-delegate: A junior analyst asks for market comps, regulatory interpretation, or lease risk conclusions without guardrails.
The Result: plausible-sounding inaccuracies that slip into deliverables and create reputational or compliance risk.Experts under-specify: A senior person assumes the model “knows what I mean” and provides thin context.
The Result: generic output, hidden assumptions, and brittle analysis.Teams don’t share a prompting language: Everyone prompts differently, so outputs are inconsistent, review is slower, and governance becomes hand-wavy (“Just be careful with AI”).
THE FRAMEWORK EXPLAINED
Core Insight (Domain Expertise × AI Fluency × Task Mode)
The intent of the framework is to remind you that “good prompting” is not a universal template. It is a repertoire you select based on who you are in that moment (expert/novice), what you are doing (discover/execute), and how comfortable you are with AI as a collaborator.
How to Use It
Before you type anything substantial, force a 10-second classification:
Am I effectively a novice or expert for this problem?
Am I in Discovery or Execution mode?
What is my AI fluency - do I know how to specify constraints, request assumption registers, and force checkability?
Typical mistakes:
Confusing seniority with domain expertise for the task.
Skipping “task mode” and asking for outputs too early.
Treating AI fluency as irrelevant (“I’m a real estate person, not a prompt engineer”).
CRE example: You are an experienced office investor exploring PBSA for the first time. You are an expert in underwriting discipline but a novice in this asset’s demand drivers and operational risks. You should start in A (Guided Exploration) and quickly move into B (Scaffolded Production) for structured outputs, rather than pretending you are in D.
Quadrant A: Guided Exploration (Discovery mode × Domain novice)
For: Domain novices learning the territory.
Technique 1: Outcome-first querying
Intent: Anchor exploration in the decision you eventually need to make.
How to use it: Ask for the shape of an answer before the content. Start with “What would a good answer look like?” or “What decision does this inform, and what inputs would it require?”
Typical mistakes: Asking for facts and figures before you know which facts matter; accepting an answer that isn’t decision-linked.
CRE example: “I’m evaluating a retail park acquisition. Outline the top 12 questions an IC needs answered and why each matters (cashflow, leasing, capex, ESG/MEES, risk). Then tell me what data I need to answer them.”
Technique 2: Terminology unpacking
Intent: Reduce ambiguity and prevent false confidence.
How to use it: Ask for definitions, distinctions, and “if you hear X, what does it imply?”
Typical mistakes: Using terms loosely (“prime”, “stabilised”, “reversionary”) and letting AI mirror your vagueness.
CRE example: “Explain the difference between ERV, passing rent, and headline rent in a UK multi-let office; list common traps when comparing deals.”
Technique 3: Map-before-territory
Intent: Build a conceptual map before you go deep.
How to use it: Ask for frameworks, taxonomies, checklists, and causal diagrams that organise a domain.
Typical mistakes: Diving into detailed drafting without a map; treating a single framework as “the truth”.
CRE example: “Create a taxonomy of data-centre underwriting risks: power, planning, customer concentration, capex, supply chain, grid constraints, and exit liquidity - then explain how each category shows up in diligence.”
Quadrant B: Scaffolded Production (Execution mode × Domain novice)
For: Domain novices who need to produce work product.
Technique 1: Template generation
Intent: Reduce cognitive load by producing a strong structure that you fill with verified inputs.
How to use it: Request a deliverable skeleton with headings, subheadings, and placeholder prompts for required data.
Typical mistakes: Letting AI fill placeholders with invented content; confusing a template with a conclusion.
CRE example: “Generate an IC pack structure for a UK office acquisition. For each section, include: required inputs, typical analyses, and ‘red flag’ questions. Use placeholders rather than invented numbers.”
Technique 2: Checklist-driven execution
Intent: Shift quality from “hope” to “process control”.
How to use it: Ask the model to create a completion checklist and a review checklist (what to verify; what to cite; what cannot be assumed).
Typical mistakes: Only checking the final narrative, not the underlying assumptions and calculations.
CRE example: “Create a QA checklist for a lease abstract summary used in underwriting: items to verify, clauses that must be escalated, and what constitutes ‘insufficient evidence’.”
Technique 3: Role-based guardrails
Intent: Force the model to behave like a constrained assistant, not a confident commentator.
How to use it: Assign a role plus rules: ask clarifying questions, provide an assumptions register, avoid fabricating, flag uncertainties.
Typical mistakes: Overly theatrical roles (“be a genius investor”) instead of operational constraints; failing to require uncertainty labelling.
CRE example prompt pattern (short):
Act as a CRE analyst. If key inputs are missing, ask for them. Use placeholders rather than guessing.
Provide:
(1) Assumptions register,
(2) Data required list,
(3) Draft output.
Do not invent rents, yields, or regulatory claims.
Quadrant C: Accelerated Analysis (Discovery mode × Domain expert)
For: Domain experts exploring new angles or complex problems.
Technique 1: Adversarial stress-testing
Intent: Use the model as a structured critic to surface fragility.
How to use it: Ask for a red-team review: “If this is wrong, how would it fail?” Force concrete failure pathways.
Typical mistakes: Asking for “pros and cons” (too generic); not tying critique to evidence requirements.
CRE example: “Red-team this investment thesis: ‘Grade A offices will rebound due to flight to quality’. Identify 8 ways it fails, what early signals would show failure, and what mitigations exist.”
Technique 2: Comparative framework generation
Intent: Avoid single-lens thinking by generating multiple analytical frames.
How to use it: Request 3–5 alternative frameworks (e.g., demand-side, regulatory, financing, operational) and compare what each highlights.
Typical mistakes: Treating frameworks as decoration rather than decision tools.
CRE example: “Analyse a workplace strategy decision using three frames: productivity/performance, talent/retention, and cost/risk. Where do they conflict?”
Technique 3: Assumption surfacing
Intent: Make hidden assumptions explicit so they can be tested.
How to use it: Ask the model to list assumptions, classify them (critical vs minor), and propose validation methods.
Typical mistakes: Allowing assumptions to remain embedded in prose.
CRE example: “List all assumptions embedded in a ‘stabilised income’ valuation narrative and propose which can be evidenced vs which require judgement.”
Technique 4: Perspective multiplication
Intent: Create decision robustness by simulating stakeholder lenses.
How to use it: Ask for outputs from specific perspectives: IC chair, lender credit, occupier, planner, ESG committee, asset manager.
Typical mistakes: Using caricatures; failing to produce actionable questions.
CRE example: “From a lender’s credit committee perspective, what are the five deal-breakers in this business plan? What evidence would satisfy each?”
Quadrant D: Precision Delegation (Execution mode × Domain expert)
For: Domain experts in production mode.
Technique 1: Front-loaded context & constraints
Intent: Replace ambiguity with bounded execution.
How to use it: Provide the scenario, the decision context, constraints, definitions, what not to do, and your preferred format.
Typical mistakes: Under-specifying constraints; assuming the model knows your house style; forgetting confidentiality boundaries.
CRE example: “Draft the ‘Risks & Mitigations’ section in our IC style: short bullets, no marketing language, each risk must have an owner and a mitigation plan.”
Technique 2: Artefact-specific commands
Intent: Tell the model exactly what artefact you are producing (memo, IC section, lease clause summary, board slide) and the acceptance criteria.
How to use it: “Produce X, for audience Y, with length Z, and include A/B/C elements.”
Typical mistakes: Asking for “a report” instead of a defined artefact.
CRE example: “Write a 250-word executive summary for an IC: thesis, key numbers placeholders, top 3 risks, recommendation.”
Technique 3: Negative specification
Intent: Prevent known failure behaviours.
How to use it: Explicitly prohibit: invented numbers, uncited claims, legal conclusions, unbounded scope, buzzwords.
Typical mistakes: Only saying what you want, not what you don’t want.
CRE example: “Do not reference specific regulations unless I provide text. If uncertain, flag as ‘needs legal check’.”
Technique 4: Output format locking
Intent: Make outputs reusable and reviewable.
How to use it: Fix headings, bullet structure, and required sections (assumptions; data gaps; confidence).
Typical mistakes: Letting format drift across iterations; mixing analysis and narrative.
CRE example: “Use exactly these headings: Background; Investment case; Key sensitivities; Risks; Mitigations; Open questions.”
Technique 5: Iterative refinement
Intent: Improve quality through controlled revision rather than re-prompting from scratch.
How to use it: Run short cycles: “Revise only section 3; keep the rest unchanged; incorporate these three changes.”
Typical mistakes: Rewriting everything (introduces new errors); failing to track what changed.
CRE example: “Revise the leasing section to reflect a 12-month void assumption and add two mitigations; do not change other sections.”
The Expert’s Meta-Skill: Mode Switching (C → D → C → D)
Intent: Experts get better outcomes by alternating between:
C (Diverge): generate options, risks, questions, frames
D (Converge/Draft): lock format, draft deliverable
C (Stress-test): red team, assumption checks, scenario attacks
D (Refine): tighten, align, finalise, QA
Typical mistake: Staying in one quadrant because it feels productive (either endless ideation or premature drafting).
CRE example: In underwriting, use C to expand risk hypotheses, D to draft the IC narrative, C to stress-test with lender/IC lenses, D to produce the final pack with an assumption register and clear decision asks.
WHY BOTHER
Perhaps this reads as prescriptive. In a way it is. Until it becomes muscle memory. Then you can iterate and ‘free solo’ your way to exceptional outcomes. The discipline is in knowing why you are doing X in Y order,
This is workflow control. You already manage risk with checklists, templates, and IC disciplines. This framework simply extends that discipline to AI-assisted work.
Use it as a structured assistant: to generate your own work frameworks, surface assumptions, draft formats, and run adversarial critique - tasks where reliability comes from constraints and review.
Do make the effort for ‘Mode switching’, because this replaces rework. It’s a slow way to get where you need to fast. Without pushing in then zooming out you miss so much, and so often that means endless versions before a final outcome. This foreshadows that by stress testing as you go.
In Quadrant D, which requires artefact-specific commands and format locking, you can upload your own house style and templates and jump straight to outputs that are ready to go.
And if you are worried that your messy data means none of this will work very well, this is exactly why you need assumption surfacing and evidence plans. The framework makes uncertainty explicit. Once known you can fill in the gaps.
Here’s a 10-minute quick start you can try out today.
Pick one live task you’re doing this week (IC pack, lease summary, board note).
Decide Discovery vs Execution. Decide whether you’re a novice or expert for that task.
Run one prompt from the matching quadrant:
A: ask for a map and definitions
B: ask for a template with placeholders + checklist
C: ask for assumption register + red team
D: lock format + constraints + negative spec
Add one mandatory control: “No invented numbers; use placeholders; list missing inputs.”
Save the best prompt as your team’s starting template.
Working with this framework will lead to compounding returns. Referencing back to the Anthropic study, how we prompt the AI determines how effective it can be.
A closing caution: this framework makes AI collaboration more effective, but “more effective” applied to the wrong task simply accelerates waste. Prompting discipline without task discipline is efficiency theatre with better production values.
This is the third in a stack of frameworks, and sequence matters. RIRA asks the strategic question: how are we creating value—faster taxis, better taxis, or Uber? The CRE Automation Matrix asks the analytical question: what kind of work is this, and what’s the right human-AI interaction model? This Prompting Framework answers the operational question: how do we actually get that work done?
Work the stack top-down. If you haven’t passed the “faster taxis or Uber?” test, no prompting technique will rescue you from building the wrong thing more efficiently. Start with strategy, filter through analysis, then reach for this framework when you’re ready to execute properly.
You're Probably Automating the Wrong Things
A framework for knowing where value actually lands
Last week we looked at RIRA- a strategy-to-execution framework for rebundling value creation in commercial real estate under conditions where AI materially changes the unit economics of analysis and content production.
This week we’re going to look at ‘The CRE Automation Matrix Framework’ - a tool for understanding where value is moving to, what to automate, and how.
WHAT THIS FRAMEWORK IS
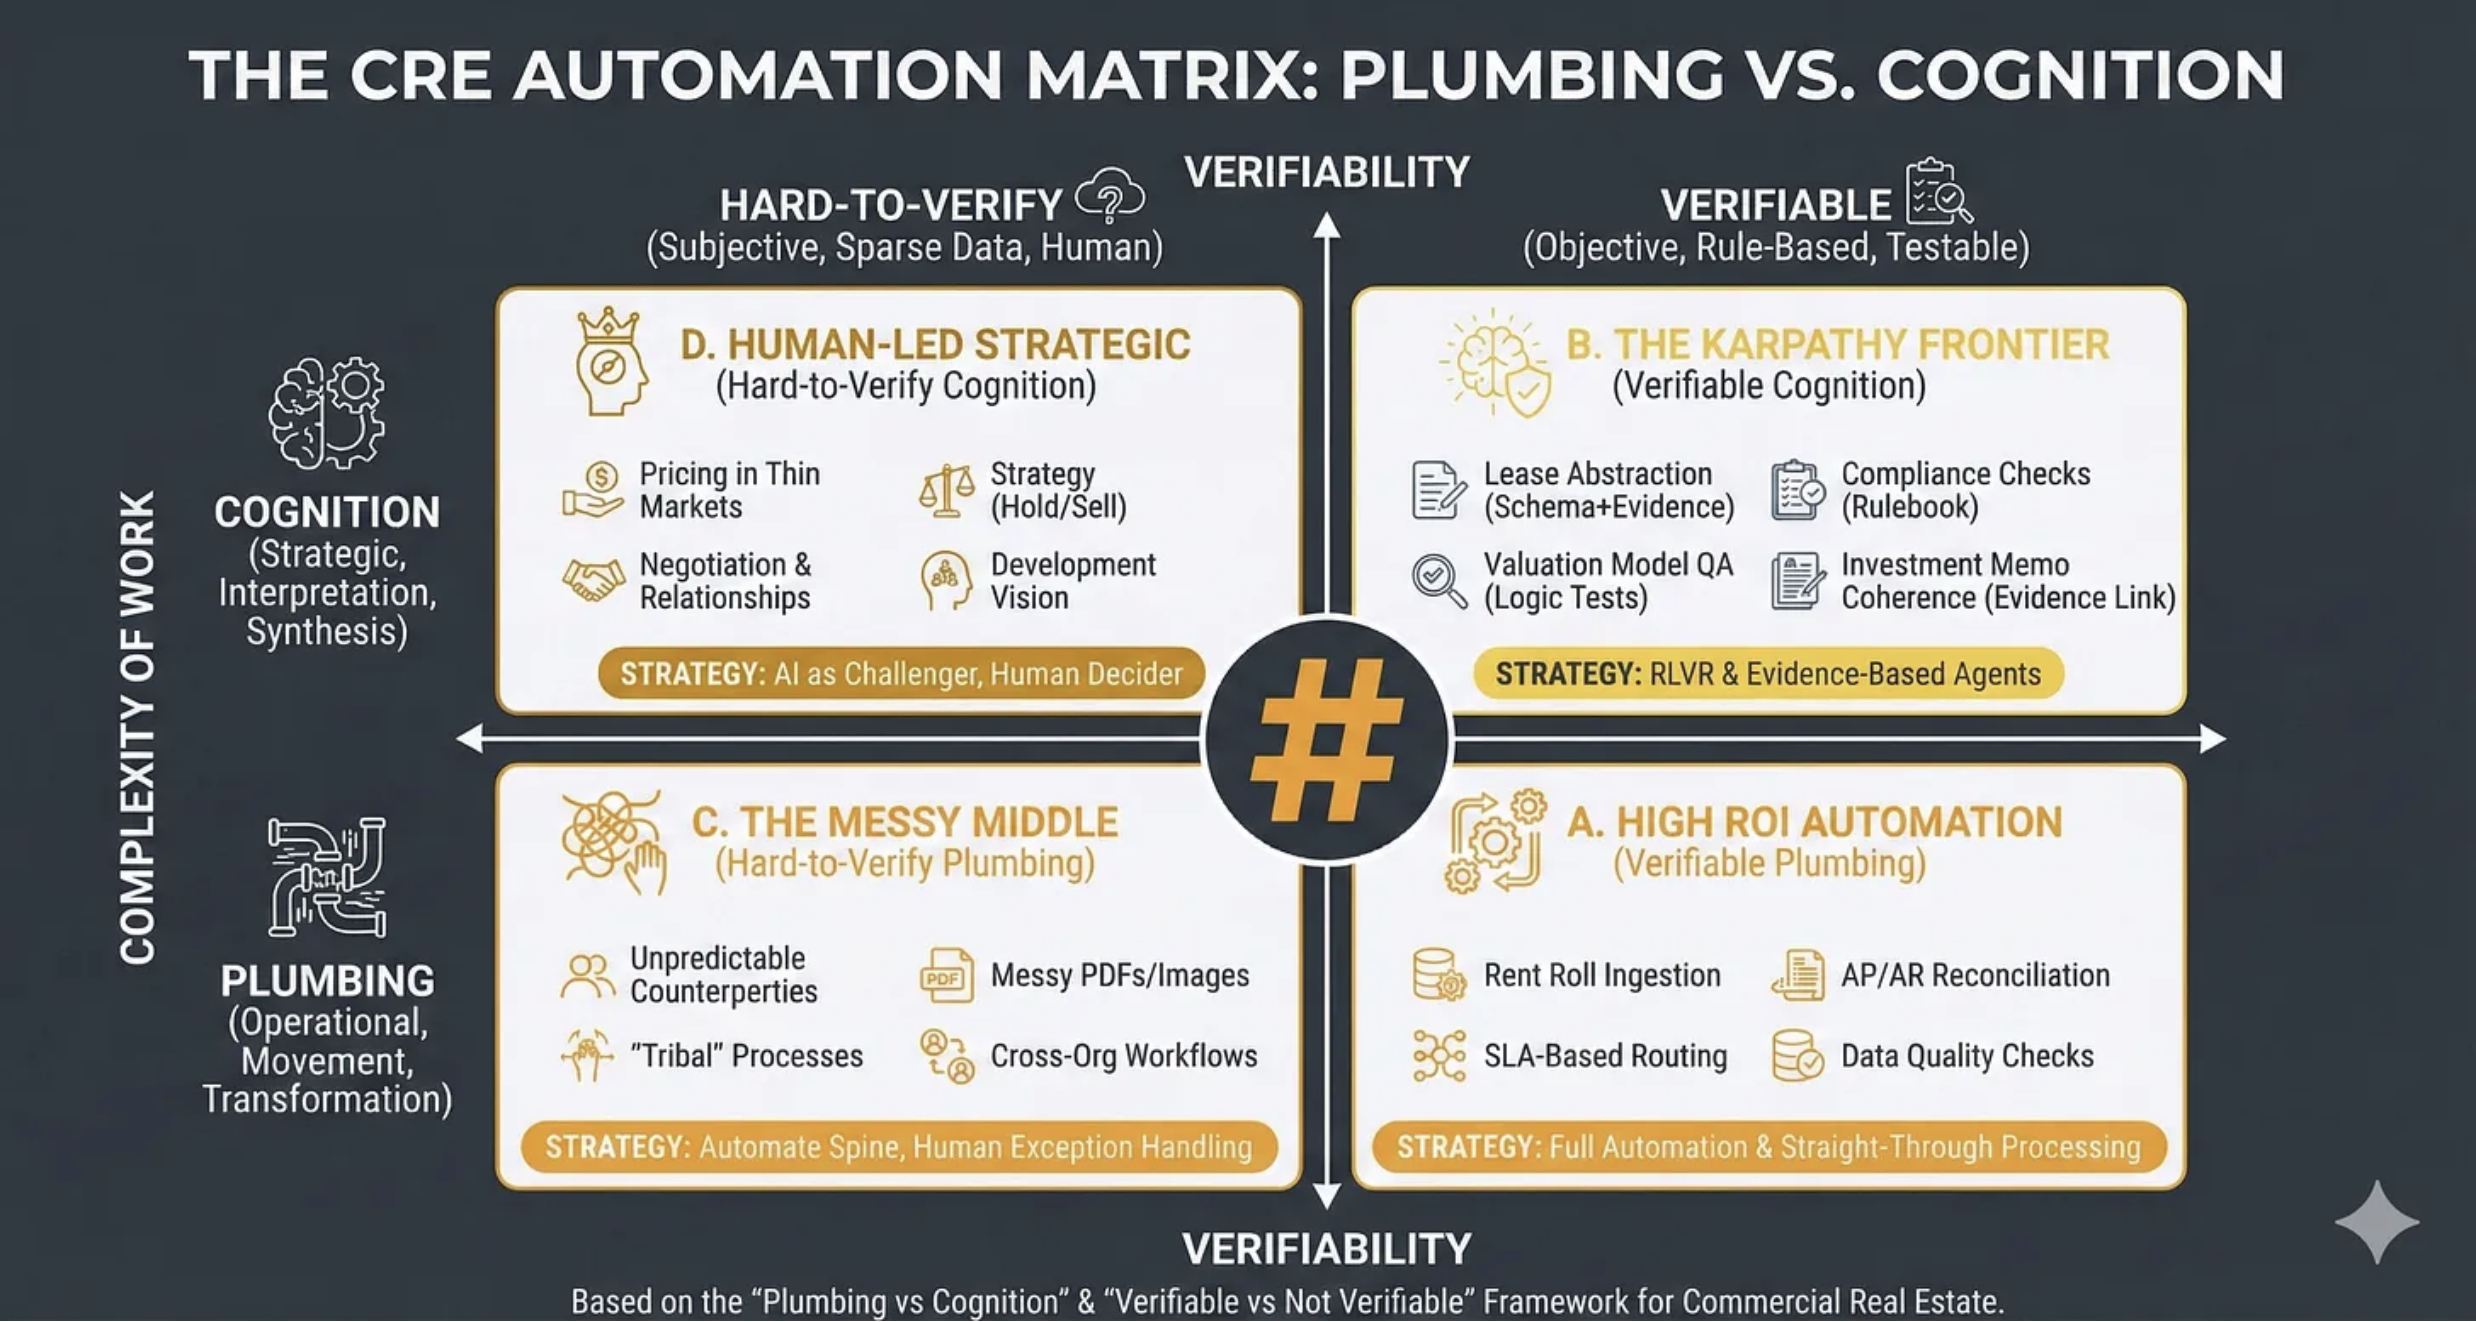
The CRE Automation Matrix is a decision framework for choosing how to apply automation and AI across commercial real estate workflows by classifying work along two dimensions:
What kind of work it is (operational “plumbing” versus strategic “cognition”)
How verifiable it is (hard-to-verify versus rule-based/testable).
Its practical purpose is to prevent two common errors:
(i) automating the wrong things (low ROI or high risk)
(ii) automating the right things with the wrong method (straight-through automation where you actually need evidence links, tests, and human exception handling).
WHY IT MATTERS: THE STRATEGIC PROBLEM
Most CRE organisations are currently “tool shopping” (Copilot, chatbots, RPA, point solutions) rather than systematically deciding where automation belongs, what must remain human-led, and what requires verifiability engineering (tests, evidence, audit trails).
This framework solves the prioritisation, design and risk control problems:
Prioritisation: Where is the highest ROI with the lowest governance burden?
Design: What automation pattern fits the reality of the work (straight-through, evidence-based agents, or human-in-the-loop)?
Risk control: Where do hallucinations, silent failures, and compliance gaps most commonly occur?
WHAT GOES WRONG WITHOUT IT
You automate cognition without verifiability
You get fluent outputs that are not defensible: investment narratives without evidence links, lease abstracts without citation, “compliance checks” that miss edge cases.
Result: reputational and financial risk.
You under-automate plumbing because it feels unglamorous
Teams chase “AI strategy” while still rekeying rent rolls, reconciling invoices manually, and firefighting data quality.
Result: the operational drag remains; AI “ROI” never shows up.
You treat messy workflows as if they were standard workflows
Cross-org tasks and tribal processes (variations, exceptions, unwritten rules) break brittle automations.
Result: compounding errors, escalation fatigue, and loss of trust in automation.
You blur accountability:
Who signed off the value?
Who verified the covenant?
Who checked the lease clause?
Without the matrix, AI adoption often smuggles in a dangerous assumption: “the model did it”.
The bottom line?
If you cannot explain how a task is verified, you are not “automating”; you are outsourcing judgement to a stochastic text generator - and hoping your governance function never notices.
WHY IT WORKS SO WELL
The power of this framework comes from the way it melds the type of work with its verifiability.
The Vertical Axis: Complexity of Work (Plumbing → Cognition)
The intent here is to understand what is the nature of the work being undertaken.
So first off you decide if a task is ‘Plumbing’ or ‘Cognition’. I.e, is it about moving, transforming, routing, reconciling, standardising or validating? In which case it is ‘Plumbing’ or is it about interpreting, prioritising, negotiating, scenario framing, decision-making, or storytelling with accountability? In which case it is ‘Cognition’.
Many tasks contain both, in which case you classify based on where the risk and value concentrate.
People make typical mistakes here: they call everything “strategy” just because it touches money. Or treat “cognition” as producing nicer text rather than making (and owning) a decision. People label anything involving writing as “strategic”, then optimise for eloquence instead of decision clarity: options, trade-offs, thresholds, owner, next action.
CRE examples might be: SLA-based triaging of incoming maintenance requests is ‘Plumbing’ whereas deciding whether to hold/sell an underperforming asset in a thinly traded submarket is ‘Cognition’.
The Horizontal Axis: Verifiability
Here the intent is to distinguish tasks where outputs can be objectively checked (rule-based/testable) from tasks where correctness is contested, contextual, or data is too sparse.
So for any task you need to ask three questions:
Is there a reference standard? (rules, schema, thresholds, contractual language, accounting logic, policy)
Can I test the output? (logic tests, reconciliation, constraints, sampling, peer review)
Can I attach evidence? (citations to leases, invoices, emails, comps, photos, source systems)
If the answer is “mostly yes”, you are on the Verifiable side. If “mostly no”, you are on Hard-to-Verify.
Typical mistakes are confusing “sounds plausible” with “verifiable”. Or assuming availability of documents equals availability of evidence (a PDF is not evidence unless you can reliably extract and cite the relevant clause). Or treating a policy statement as a test (a test requires pass/fail conditions).
CRE examples might be:
Verifiable - “Does the rent roll total match the general ledger control account within tolerance?” (reconcilable)
Hard-to-verify - “Is this tenant likely to renew if we refurbish?” (contextual, behavioural, market-driven)
So with these variables in place we get to having:
FOUR QUADRANTS
Quadrant D
Human-Led Strategic (Hard-to-Verify Cognition)
Where the intent is to protect genuinely strategic, low-verifiability decisions from premature automation while still using AI to improve the quality of thinking.
Such as here: Pricing in Thin Markets; Negotiation and Relationships; Strategy (Hold/Sell); Development Vision.
Strategically this is about: ‘AI as Challenger, Human Decider’.
Quadrant B
The Karpathy Frontier (Verifiable Cognition)
Where the intent is to capture the emerging sweet spot: tasks that feel cognitive (reading, reasoning, writing) but can be engineered to be verifiable through evidence links and tests. This is where AI can be powerful and governable.
Such as here: Lease Abstraction (Schema+Evidence); Compliance Checks (Rulebook); Valuation Model QA (Logic Tests); Investment Memo Coherence (Evidence Link).
Strategically this is about: ‘Reinforcement Learning with Verifiable Rewards’ and Evidence-Based Agents.
NOTE: Andrej Karpathy is one of the most revered AI researchers in the world and he has recently been arguing that the most promising frontier for AI capability expansion lies in domains where outputs can be verified programmatically - enabling models to learn from feedback loops rather than human labelling. This quadrant represents that frontier applied to CRE.
Quadrant C
The Messy Middle (Hard-to-Verify Plumbing)
Where the intent is to acknowledge where automation fails most often: not because the task is “hard”, but because the environment is non-standard (variable inputs, inconsistent behaviours, cross-boundary handoffs).
Such as here: Unpredictable Counterparties; Messy PDFs/Images; “Tribal” Processes; Cross-Org Workflows.
Strategically this is about: Automating the Spine, Human Exception Handling. The goal isn’t eliminating humans from these workflows; it’s ensuring they’re only invoked where they add value, not where they’re compensating for brittle automation.
Quadrant A
High ROI Automation (Verifiable Plumbing)
Where the intent is to focus attention on the “boring” work that yields disproportionate ROI because it is frequent, standardisable, and testable.
Such as here: Rent Roll Ingestion; AP/AR Reconciliation; SLA-Based Routing; Data Quality Checks.
Strategically this is about: Full Automation and Straight-Through Processing
FROM TASKS TO WORKFLOWS
Most workflows span multiple quadrants - a quarterly asset review involves Quadrant A reconciliation, Quadrant B compliance checks, and Quadrant D hold/sell judgement. The framework’s purpose is to decompose workflows into constituent tasks and optimise each appropriately.
This connects directly to last week’s RIRA framework. The ‘Redesign’ phase isn’t just about improving individual tasks - it’s about re-architecting workflows so that quadrant transitions become deliberate design decisions. Where does verification occur? Where do evidence chains form? Where does human judgement enter and exit?
The Karpathy Frontier matters here because verifiable cognition is what enables linkage. A cognitive task that produces verified, evidence-linked outputs can feed downstream automation. One that doesn’t creates a break - requiring human review not because the task demands judgement, but because its output can’t be trusted by the next process in the chain.
WHERE’S THE VALUE?
Dive deep into these quadrants and it becomes very clear where automation should occur, and how.
More importantly though, they tell you where future value lies and the future shape of the real estate industry.
Verifiable Plumbing must be automated asap - because it will be relatively easy to do so, and everybody will. Which means you have to do it but you’ll not find much value there. Short term (say up to 2 years) early movers will gain an advantage but eventually all gains will be competed away.
Hard-to-verify plumbing is why you’ll still be in business, and why per unit of output labour reduction will be limited. Because it’s where the ‘messy middle’ tasks lie; tasks that aren’t particularly high-value but are very hard to automate. This will be the refuge of the complacent, and Luddite. They’ll rely on this ‘irreducibly human’ work to see them through. The problem with that is that it will be relatively short lived - AI will ‘come for’ more and more of this work over time. As capabilities expand more messiness will be automatable.
Verifiable cognition is where good money lies. Because making it verifiable is hard, complex, detailed, and reliant on excellent systems and smart domain knowledge. Only the best companies will be able to automate this work, and it’s unlikely to be commoditised. Sure, individual Lease Abstraction will be, but maybe not easily at scale, and at maximum accuracy. And seamlessly linked in as part of wider workflows. This is where tacit knowledge will become explicit, but protected by IP rights.
The best money though will be in hard-to-verify cognition. Areas where there is genuine and likely persistent human irreducibility. This is where tacit knowledge cannot be codified, and genuine ‘wisdom’ resides. Along with, probably, some formats of proprietary data and knowledge. This is where all the due diligence has been done and is looking good, but the advice comes to ‘don’t do the deal’. This game though is played in rarified air. Getting to play won’t be easy.
This CRE Automation Matrix is the analytical follow-up to the strategic vision you’ll develop with last week’s RIRA framework. And is to be used with it, in a circular way. You’re working on your H1, H2, and H3 visions but where do the component parts sit within this matrix? Are they defensible? Is that where value will be found?
CONCLUSION
In five years, the firms that automated plumbing will be table-stakes competitive. The firms that engineered verifiability into their cognitive work will be pulling ahead. And the firms that built genuine strategic judgement—the hard-to-verify cognition that can’t be copied—will be playing a different game entirely.
The matrix doesn’t tell you which game to play. It shows you which game you’re currently in.